关键词:
一、前言
吐槽一下,百度在国内除了百度地图是良心产品外,其他的真的不敢恭维。在上一篇笔记里,我已经实现了自定义的地图测量模块。在百度地图里面(其他地图)都有一个周边搜索的功能,拖拽画一个圆,然后以圆半径进行搜索(也就是缓冲区╮(╯_╰)╭)。
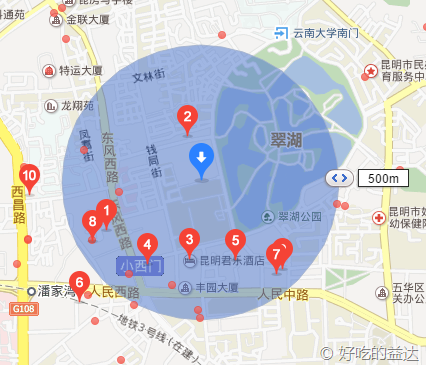
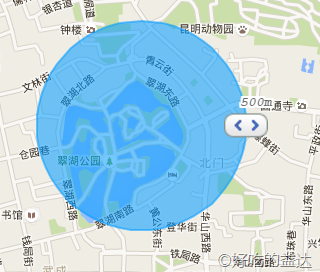
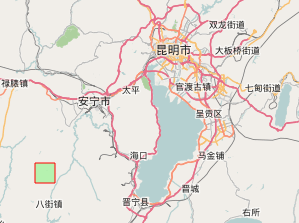
这次的目标,就是要山寨这个拖拽画圆的功能,我先放一个效果图。
二、开始山寨
我们先想一想要实现这个功能需要哪些步骤。
- 拖拽
- 画圆
- 通知拖拽结束
2.1 实现拖拽
关于拖拽,有graphicslayer的拖拽事件和map的拖拽事件,如何选择呢?先来看一看官方文档。

graphicslayer 的鼠标事件

map的鼠标事件
在graphic的鼠标事件里面,鼠标事件触发的条件是鼠标必须在一个graphic上(红色标记处),但是graphicslayer的mouse-drag事件好像并不要这个条件,而且事件说明和map的一样。我们在仔细看一下文档,Arcgis文档在这个细节处理上特别值得学习。graphicslayer和map的鼠标事件文档中,开头都是mouse-down(mouse button is pressed down),结尾都是mouse-up(mouse button is released)。现在大家都发现了吧,两者的drag事件都是和mouse-down、mouse-up有关联的。首先,按下鼠标(mouse-down)是触发drag 的前提条件。然后,松开鼠标(mouse-up)是drag事件结束的标识。也就是说,如果要触发drag事件,就一定会触发mouse-down和mouse-up事件,所以graphicslayer的drag事件也需要鼠标在graphic上才能触发。
解释的不错,我选择map!下面先上两段代码来说一下为什么要选择map的drag事件原因。
map的鼠标事件,添加了一个graphicslayer和一个graphic
require([
                "dojo/dom", "dojo/on",
                "esri/map","esri/layers/GraphicsLayer", "esri/geometry/Point", "esri/symbols/SimpleMarkerSymbol",
                "esri/symbols/SimpleLineSymbol", "esri/graphic", "esri/Color",
                "dojo/domReady!"],
            function (dom, on, Map, GraphicsLayer,Point,
                      SimpleMarkerSymbol, SimpleLineSymbol, Graphic, Color) {
                var map = new Map("map", {
                    center: [103, 24.5],
                    zoom: 9,
                    basemap: "osm"
                });
                var graphicsLayer=new GraphicsLayer();
                map.addLayer(graphicsLayer);
                map.on("load", function () {
                    var sms = new SimpleMarkerSymbol(SimpleMarkerSymbol.STYLE_SQUARE, 20,
                            new SimpleLineSymbol(SimpleLineSymbol.STYLE_SOLID,
                                    new Color([255, 0, 0]), 1),
                            new Color([0, 255, 0, 0.25]));
                    var point = new Point(103, 24.5);
                    var graphic = new Graphic(point, sms);
                    map.graphics.add(graphic);
                    graphicsLayer.add(graphic);
                });

                map.on("mouse-down", function (evt) {
                    console.log("map:mouse-down");
                });

                map.on("mouse-drag", function (evt) {
                    console.log("map:mouse-drag");
                });

                map.on("mouse-up", function (evt) {
                    console.log("map:mouse-up");
                });
            });
当在map上进行拖拽时,控制台的输出如下:
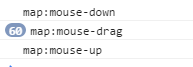
当把鼠标移动到graphic上进行拖拽时,控制台输出如下:
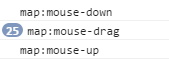
它也触发了地图的拖拽事件。
接着在看一看graphicslayer的鼠标事件,我添加了一个graphicslayer和一个graphic。
require([
                "dojo/on",
                "esri/map", "esri/layers/GraphicsLayer", "esri/geometry/Point", "esri/symbols/SimpleMarkerSymbol",
                "esri/symbols/SimpleLineSymbol", "esri/graphic", "esri/Color",
                "dojo/domReady!"],
            function (on, Map, GraphicsLayer, Point,
                      SimpleMarkerSymbol, SimpleLineSymbol, Graphic, Color) {
                var map = new Map("map", {
                    center: [102, 24.5],
                    zoom: 9,
                    basemap: "osm"
                });
                var graphicsLayer=new GraphicsLayer();
var graphic;
                map.addLayer(graphicsLayer);
                map.on("load", function () {
                    var sms = new SimpleMarkerSymbol(SimpleMarkerSymbol.STYLE_SQUARE, 20,
                            new SimpleLineSymbol(SimpleLineSymbol.STYLE_SOLID,
                                    new Color([255, 0, 0]), 1),
                            new Color([0, 255, 0, 0.25]));
                    var point = new Point(102, 24.5);
                    graphic = new Graphic(point, sms);
                    graphicsLayer.add(graphic);
                    console.log(map.graphics)
                });
                graphicsLayer.on("mouse-down", function (evt) {
                    console.log("graphicslayer:mouse-down");
                });

                graphicsLayer.on("mouse-drag", function (evt) {
                    console.log("graphicslayer:mouse-drag");
                });

                graphicsLayer.on("mouse-up", function (evt) {
                    console.log("graphicslayer:mouse-up");
                });

            });
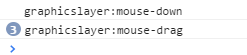
当在map上拖拽时候,这时候给人的感觉应该是,graphicslayer也在地图上,也应该会触发graphicslayer的拖拽事件,然而并没有,这时候控制台的输出为:

当把鼠标移动到graphic上进行拖拽时,控制台输出如下:
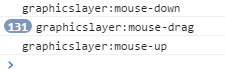
这时终于触发了graphicslayer的拖拽事件。
到现在为止,感觉好像二者区别不大。但是在进行拖拽时,移动的是地图,我们要实现的效果是移动graphic,这时就要用到如下方法:

我们先来实现在graphicslayer上移动graphic。
graphicsLayer.on("mouse-down", function (evt) {
      console.log("graphicslayer:mouse-down");
      map.disableMapNavigation();
     });

 graphicsLayer.on("mouse-drag", function (evt) {
       console.log("graphicslayer:mouse-drag");
       graphic.setGeometry(evt.mapPoint);
     });

graphicsLayer.on("mouse-up", function (evt) {
       console.log("graphicslayer:mouse-up");
       map.enableMapNavigation();
     });
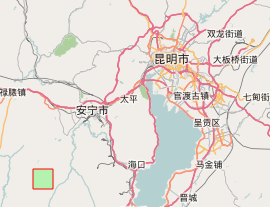
我们把graphic移动到昆明市,看看控制台的输出:
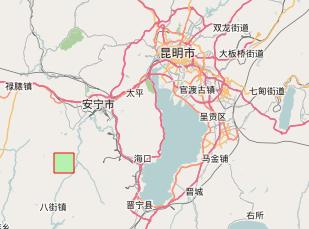
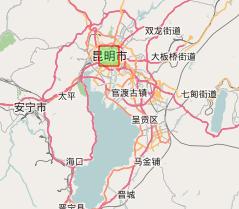
这时在拖拽事件里移动了graphic,而且事件也按预期的顺序发生了。但是!但是!但是!这是鼠标一直在graphic上的时候才能触发的事件,当我们飞快的移动鼠标,使鼠标不在graphic上,这时就会有奇怪的行为发生了。
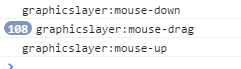
还是把graphic移动到昆明市(以很快的速度),看看控制台的输出:
当鼠标移动到昆明市的时候,松开鼠标,并没有触发mous-up事件。现在在吧鼠标移到graphic上,你会发现不用点击鼠标graphic也会随着鼠标一起移动,要停止的话只有再次点击鼠标并松开,这时控制台输出如下:

所以如果选用graphiclayer的drag事件来实现拖拽按钮的话,用户体验会很糟糕,所以graphicslayer的drag事件不能用!
接下来实现map的drag事件,删除原来map的mouse-donw 事件,替换成graphicslayerdmouse-down。接着在graphic上加了个
isMouseDown属性,判断是否要拖拽这个graphic。
graphicsLayer.on("mouse-down", function (evt) {
     console.log("graphicslayer:mouse-down");
     graphic.isMouseDown=true;
     map.disableMapNavigation();
   });

map.on("mouse-drag", function (evt) {
     console.log("map:mouse-drag");
     if( graphic.isMouseDown){
     graphic.setGeometry(evt.mapPoint);
     }
  });

map.on("mouse-up", function (evt) {
      console.log("map:mouse-up");
      map.enableMapNavigation();
      graphic.isMouseDown=false;
   });
这次就能很好的解决在graphicslayer上遇到的问题。
2.2画圆
解决了拖拽的问题,接下来就可以实现拖拽画圆了。我们传入中心点绘制制初始化圆,默认半径为500米,
startDrawCircle: function (centerPoint) {
                this._unregistMapEvents();
                this.centerPoint = centerPoint;
                this.circle = this._createCircle(centerPoint, 500);
                var dragPoint = this._createDragBtnPoint(this.circle, centerPoint);

                this.circleGraphic = new Graphic(this.circle, this.defaults.fillSymbol);
                this.labelGraphic = new Graphic(dragPoint, this._createDistanceSymbol(500));
                var dragGraphic = new Graphic(dragPoint, this.defaults.dragButtonSymbol);

                this._measureLayer.add(this.circleGraphic);
                this._measureLayer.add(dragGraphic);
                this._measureLayer.add(this.labelGraphic);
                this._initialMapEvents();
            },
第一步我们先取消上一次的画圆注册的map鼠标事件,第二步添加初始化圆,第三添加拖拽按钮和半径文描述。在计算拖拽按钮的为止时,可以用圆的extent来进行计算。
_createDragBtnPoint: function (geometry, center) {
                var extent = geometry.getExtent();
                var xmax = extent.xmax;
                returnnew Point([xmax, center.y], center.spatialReference)
            },
好了,现在所有的准备工作已经就绪,在结合前面的graphic拖拽,就可以轻松愉快的完成拖拽画圆了。
2.3通知拖拽结束
当每一次拖拽结束是,发出一次通知告诉用户绘制结束是很有必要的。这次就借助map的drag-end事件来通知用户
map.on("mouse-drag-end", lang.hitch(this, function (evt) {
  if (this.dragGraphic && this.dragGraphic.isMouseDown) {
   this.emit("drag-end", {circle: this.circle});
   this.dragGraphic.isMouseDown = false;
   this.defaults.map.enableMapNavigation();
   this.defaults.map.setMapCursor("default");
   }
})
通过 this.emit("drag-end", {circle: this.circle}); 我们就可以向外部发出拖拽结束的通知。
2.4 源码
/**
 * Created by Extra
 * Description:实现拖拽绘制圆,仿百度缓冲区搜索样式
 * version: 1.0.0
 */
define("dextra/dijit/DrawDragCircle", [
        "require",
        "dojo/dom",
        "dojo/query",
        "dojo/_base/declare",
        "dojo/_base/lang",
        "dojo/Evented",
        "dojo/on",
        "esri/graphic",
        "esri/layers/GraphicsLayer",
        "esri/Color",
        "esri/symbols/Font",
        "esri/geometry/Point",
        "esri/geometry/Circle",
        "esri/geometry/Polyline",
        "esri/symbols/SimpleMarkerSymbol",
        "esri/symbols/PictureMarkerSymbol",
        "esri/symbols/SimpleLineSymbol",
        "esri/symbols/SimpleFillSymbol",
        "esri/symbols/TextSymbol",
        "esri/geometry/geometryEngine",
    ],
    function (require, dom, query, declare, lang, Evented, on,
              Graphic, GraphicsLayer,
              Color, Font, Point, Circle, Polyline, MarkerSymbol, PictureMarkerSymbol, LineSymbol, FillSymbol, TextSymbol, geometryEngine) {
        return declare(Evented, {
            declaredClass: "dextra.dijit.DrawDragCircle",
            defaults: {
                map: null,
                maxRadius: 5000,
                markerSymbol: new MarkerSymbol(MarkerSymbol.STYLE_SQUARE, 20,
                    new LineSymbol(LineSymbol.STYLE_SOLID,
                        new Color("#DC143C"), 2),
                    new Color("#FFA500")),
                dragButtonSymbol: new PictureMarkerSymbol({
                    "url": require.toUrl("./images/dragButton.png"),
                    "height": 21,
                    "width": 33
                }),
                lineSymbol: new LineSymbol(
                    LineSymbol.STYLE_SOLID,
                    new Color("#FFA500"), 2),
                fillSymbol: new FillSymbol(FillSymbol.STYLE_SOLID,
                    new LineSymbol(LineSymbol.STYLE_SOLID,
                        new Color([0, 155, 255, 0.55]), 2), new Color([0, 155, 255, 0.55])),
            },
            circleGraphic: null,
            circle: null,
            labelGraphic: null,
            dragGraphic: null,
            _measureLayer: null,
            _mapEvents: [],

            constructor: function (options) {
                declare.safeMixin(this.defaults, options);
                this._measureLayer = new GraphicsLayer();
                this.defaults.map.addLayer(this._measureLayer);
                this._initialMeasureLayer();

            },

            //初始化测量图层事件
            _initialMeasureLayer: function () {
                //开始拖拽绘制圆this._measureLayer.on("mouse-down", lang.hitch(this, function (evt) {
                    var graphic = evt.graphic;
                    if (graphic.symbol.type == "picturemarkersymbol") {
                        this.dragGraphic = graphic;
                        this.dragGraphic.isMouseDown = true;
                        this.defaults.map.disableMapNavigation();
                        graphic.getDojoShape().moveToFront();
                        this.defaults.map.setMapCursor("pointer");
                    }
                }));

                //提示可以拖拽this._measureLayer.on("mouse-over", lang.hitch(this, function (evt) {
                    var graphic = evt.graphic;
                    if (graphic.symbol.type == "picturemarkersymbol") {
                        this.defaults.map.setMapCursor("pointer");
                    }
                }));

               //恢复鼠标状态this._measureLayer.on("mouse-out", lang.hitch(this, function (evt) {
                    this.defaults.map.setMapCursor("default");
                }));
            },

            _initialMapEvents: function () {
                this._mapEvents = [];
                //拖拽绘制圆this._mapEvents.push(this.defaults.map.on("mouse-drag", lang.hitch(this, function (evt) {
                    if (this.dragGraphic != null && this.dragGraphic.isMouseDown) {
                        var dragGraphic = this.dragGraphic;
                        var dragPoint = evt.mapPoint;
                        if (this.centerPoint.y != dragPoint.y) {
                            dragPoint.setY(this.centerPoint.y);
                        }
                        var radius = this._calDistance(this.centerPoint, dragPoint);
                        if (radius <= this.defaults.maxRadius) {
                            this._measureLayer.remove(this.circleGraphic);
                            this.circle = this._createCircle(this.centerPoint, radius);
                            this.circleGraphic = new Graphic(this.circle, this.defaults.fillSymbol);
                            dragGraphic.setGeometry(dragPoint);

                            this.labelGraphic.setGeometry(dragPoint).setSymbol(this._createDistanceSymbol(radius))
                            this._measureLayer.add(this.circleGraphic);
                            this.circleGraphic.getDojoShape().moveToBack();
                            dragGraphic.getDojoShape().moveToFront();
                        }
                    }
                })));

                //触发"mouse-drag-end,通知拖拽结束this._mapEvents.push(this.defaults.map.on("mouse-drag-end", lang.hitch(this, function (evt) {
                    if (this.dragGraphic && this.dragGraphic.isMouseDown) {
                        this.emit("drag-end", {circle: this.circle});

                        this.dragGraphic.isMouseDown = false;
                        this.defaults.map.enableMapNavigation();
                        this.defaults.map.setMapCursor("default");
                    }
                })));
            },

            //取消上一次注册的map鼠标事件
            _unregistMapEvents: function () {
                for (var i = 0; i < this._mapEvents; i++) {
                    if (this._mapEvents[i]) {
                        this._mapEvents[i].remove();
                    }
                }
                this._mapEvents=[];
            },

            startDrawCircle: function (centerPoint) {
                this._unregistMapEvents();
                this.centerPoint = centerPoint;
                this.circle = this._createCircle(centerPoint, 500);
                var dragPoint = this._createDragBtnPoint(this.circle, centerPoint);

                this.circleGraphic = new Graphic(this.circle, this.defaults.fillSymbol);
                this.labelGraphic = new Graphic(dragPoint, this._createDistanceSymbol(500));
                var dragGraphic = new Graphic(dragPoint, this.defaults.dragButtonSymbol);

                this._measureLayer.add(this.circleGraphic);
                this._measureLayer.add(dragGraphic);
                this._measureLayer.add(this.labelGraphic);
                this._initialMapEvents();
            },

            removeCircle: function () {
                this.centerPoint = null;
                this.circleGraphic = null;
                this.labelGraphic = null;
                this._measureLayer.clear();
            },

            _createCircle: function (point, distance) {
                returnnew Circle(point, {
                    "radius": distance
                });
            },

            _createDragBtnPoint: function (geometry, center) {
                var extent = geometry.getExtent();
                var xmax = extent.xmax;
                returnnew Point([xmax, center.y], center.spatialReference)
            },

            _createDistanceSymbol: function (distance) {
                distance = distance.toFixed(0) + "m";
                var fontColor = new Color("#696969");
                var holoColor = new Color("#fff");
                var font = new Font("10pt", Font.STYLE_ITALIC, Font.VARIANT_NORMAL, Font.WEIGHT_BOLD, "Courier");
                var textSymbol = new TextSymbol(distance, font, fontColor);
                textSymbol.setOffset(10, 20).setHaloColor(holoColor).setHaloSize(2);
                textSymbol.setAlign(TextSymbol.ALIGN_MIDDLE);
                return textSymbol;
            },

            _calDistance: function (point1, point2) {
                var line = new Polyline(this.defaults.map.spatialReference);
                line.addPath([point1, point2]);
                return geometryEngine.distance(point1, point2, "meters");
            },
        });
    })